The DICOM Viewer’s user interface consists of the following:
- Images panel
- Viewer toolbar
- Main window
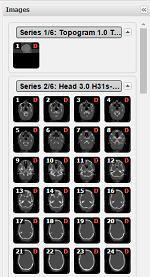
The images panel is a large panel on the left sidebar that has thumbnails of the current study. You can jump to any image in the study either by double-clicking a thumbnail or by dragging it to the main window.
The toolbar contains buttons that help you view the images:
 – the arrow buttons allow you to jump to the next or the previous image in the study. You can also use
the mouse wheel to scroll back or forward, or press the space bar to see the next page.
 – the pan tool allows you to move the image in the viewer (useful when the image is zoomed in).
 – the reset button resets the view to the original mode, as if it was opened for the first time.
 – the window / level tool allows you to change the brightness/contrast of the image. Select this tool,
hold the left mouse button on the image, and move the mouse either vertically or horizontally in order to
change the brightness/contrast.
 – the point tool (Ctrl+~) allows
you to measure the number of Hounsfield units in a particular point.
 – the distance measurement tool (Ctrl+1) is used to measure the distance between two points.
 – the angle measurement tool (Ctrl+2) allows you to draw two lines and measure the angle between them.
 – the rectangle / square tool (Ctrl+3) allows you to draw a rectangle or a square and display its area
and perimeter. To draw a square, hold the Shift key while using this tool.
 – the ellipse / circle tool (Ctrl+4) allows you to draw an ellipse or a circle and display its area and
circumference. To draw a circle, hold the Shift key while using this tool.
 – the peak velocity / gradient tool (Ctrl+5) is used to read velocity and gradient values from plots.
 – the freehand drawing tool (Ctrl+6) allows you to draw figures by placing points on the image. To finish
drawing, click the initial point.
 – the area / circumference tool (Ctrl+7) allows you to draw arbitrary closed shapes.

 – you can use these tools to determine the mean number of Hounsfield units in a particular area. When you
select an area using them the system shows the mean value.
 – the calibration tool (Ctrl+8) is used to calibrate the distance measurements by entering a correction
value.
 – the annotation tool (Ctrl+9) allows you to add text labels to the image.
 – zoom in (Ctrl +), zoom out (Ctrl -) and custom zoom tools. Alternatively you can hold the Shift key and
use the mouse wheel to zoom in or out.
 – the multiframe video tools allow you to pause a video clip (e.g. a moving image sequence typical in
echocardiology studies) and view it frame-by-frame.
 – the Layout and Options buttons are in the right upper corner.
 – the Layout button allows you to view multiple images side by side.
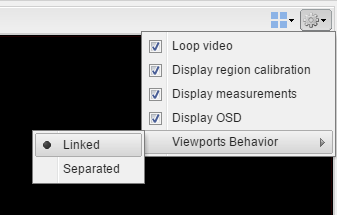
 – the Options button is used to specify how the data will look when it is viewed.
Loop video: check the loop video box and the video will be repeated continuously. When the box is unchecked you need to click Play / Pause Video button to play the video again.
- Display region calibration.
- Display measurements: this check box controls whether measurements are displayed or not.
- Display OSD: this check box controls whether image information is displayed or not.
- Viewports Behavior (Linked / Separated) is helpful when using different layout views to customize how the images are displayed.
- Linked – images are displayed in the particular order as they are on the left sidebar.
- Separated – allows you to choose what image to be displayed in each section.


