The Analysis module allows you to see your business’s key financial performance data. To open the module, sign into your account on your EMSOW site and click ANALYSIS in the upper navigation bar, then select the required section in the drop-down menu:

Below is the description of the Analysis module’s sections.
Reading turn around time analysis
In this section of the Analysis module, you can view the statistics for the reading turnaround time (the period of completing a reading cycle). To open it, click ANALYSIS on the upper navigation bar, then select READING TURN AROUND TIME ANALYSIS in the drop-down menu. The Reading Turn Around Time Analysis tab will open:

Here you can see the reading turnaround time statistics arranged in the following columns: Service ID, Reading facility, Reading doctor, Study, AVG time (average time), RMS time (root mean square time), MAX time (maximal time), MIN time (minimal time), and Count (displays how many studies were read).
Above the reading turnaround time statistics there are several fields which allow you to change the representation of the data:
Date – in these fields, you can select a date range for the reading turnaround time statistics. Select the start date in the from field and the end date in the to field:
Filter by – in these fields, you can filter the turnaround time statistics by reading facility, reading doctor, and study:
Group by – these checkboxes let you change the way how the reading turnaround time statistics is grouped: by reading facility, reading doctor, or study:
You can deselect all checkboxes to disable grouping.
Only positive reading – click this checkbox to disregard negative values of reading turnaround time:
Refresh – click this button to refresh displayed data:
Finance analysis
In this section of the Analysis module, you can view the revenue data based on actual reimbursement postings from insurance carriers. This data is updated and leveraged in real time for maximum accuracy. To open it, click ANALYSIS on the upper navigation bar, then select FINANCE ANALYSIS in the drop-down menu. The Finance Analysis tab will open:
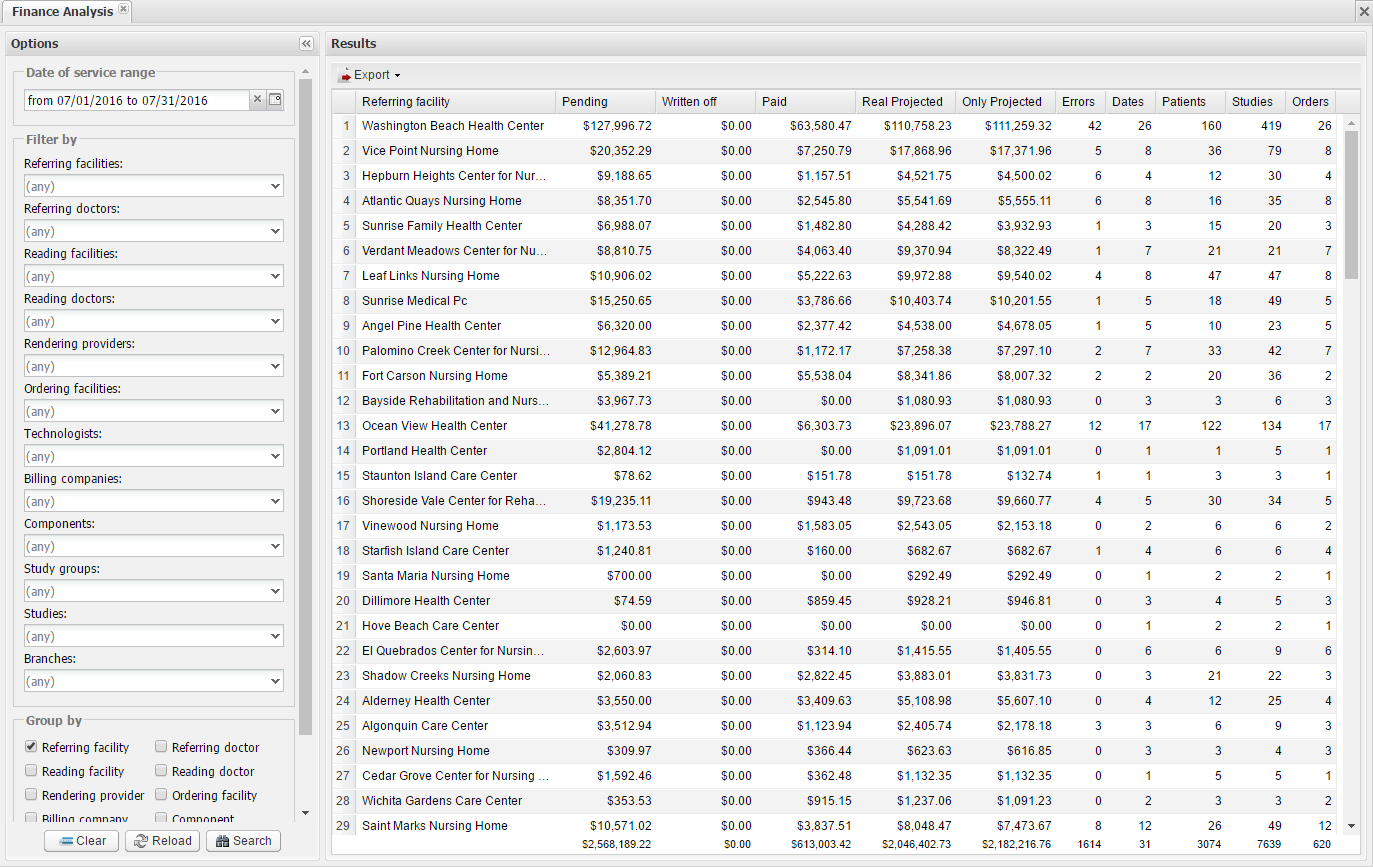
Here you can see the left sidebar and the list of search results (finance analysis data) on the right.
The left sidebar provides a search filter with numerous search options. It allows you to specify the date of service range (specific date or date range), referring facilities, referring doctors, reading facilities, reading doctors, rendering providers, ordering facilities, technologists, billing companies, components, study groups, studies, and branches. You can also select the way how the search results are grouped: by referring facility, reading facility, rendering provider, billing company, technologist, branch, referring doctor, reading doctor, ordering facility, component, and year/month.
After you specify the necessary fields, click the Search button to display the required finance analysis data. To reset all fields, click the Clear button. The Reload button allows you to reload the search results. It can be useful after you have changed some of the search fields.
Finance analysis data is arranged in columns. The first columns represent the selected way of data grouping (Referring facility, Reading facility, and so on). To the right of them, you can see the Pending, Written off, Paid, Real Projected, Only Projected, Errors, Dates, Patients, Studies, and Orders columns. Right above the Finance analysis data there is the Export button. It allows you to export the finance analysis data to an Excel, Excel 2007, CSV, PDF, or HTML file.
The Pending column displays the amount that is pending insurance payment.
The Written off column displays the write-off amount which is the difference between a provider’s fee for healthcare services and the amount that an insurance company is willing to pay for those services that a patient is not responsible for. The write-off amount may be categorized as a “not covered” amount for billing purposes.
The Paid column displays the amount that has been paid.
The Real Projected column displays the projected amount that must be paid.
The Only Projected column also displays the projected amount to be paid, but this amount is based on the billing projected settings (to access them, follow the path: SETUP → BILLING → BILLING PROJECTED).
The Errors column displays the number of estimation errors.
The Dates column displays the number of days within the date of service range when services were rendered.
The Patients, Studies, and Orders columns display the number of patients, studies, and orders respectively.
To view more detailed information about each group, double-click the required row. The Group details window will appear:
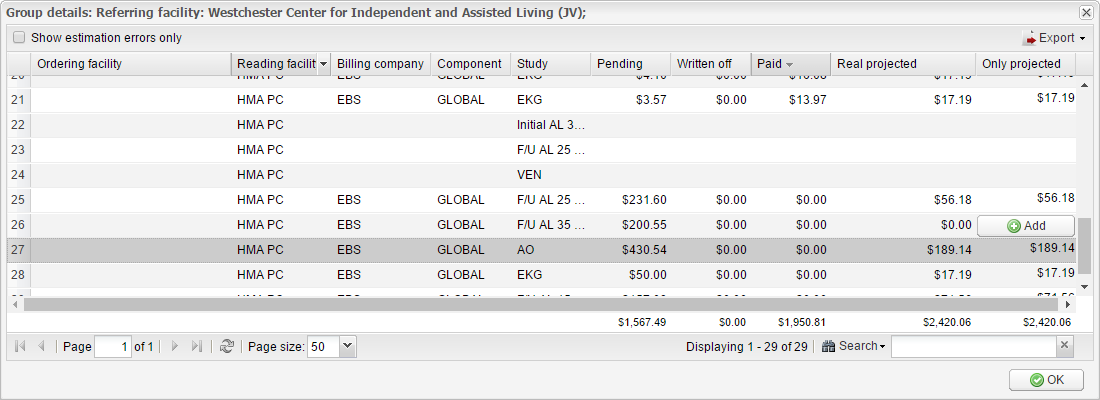
Here you can see the detailed information about each rendered service and study. All data is arranged in the following columns: Ordering facility, Branch, Referring doctor, Reading facility, Reading doctor, Rendering provider, Billing company, Technologist, Component, Study, CPT, Units, Submission date, Closed, Order ID, DoS, Service ID, Patient, Primary insurance, Pending, Written off, Paid, Real projected, and Only projected.
The last column may contain the Add button that lets you change the real projected amount. When you click this button, the Edit billing projected record window appears:
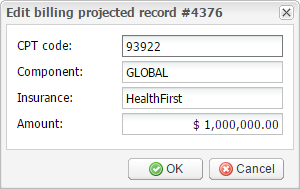
In the Amount field, enter the new real projected amount. Then click OK to update the real projected amount or click Cancel to close the window without saving.
The Group details window has the Show estimation errors only checkbox in the upper left corner. Click this checkbox to display estimation errors only.
The Export button in the upper right corner of the window allows you to export the group details to an Excel, Excel 2007, CSV, PDF, or HTML file.
Income aging analysis
In this section of the Analysis module, you can view the income distribution over a specific period of upcoming months. To open the section, click ANALYSIS on the upper navigation bar, then select INCOME AGING ANALYSIS in the drop-down menu. The Income Aging Analysis tab will appear:
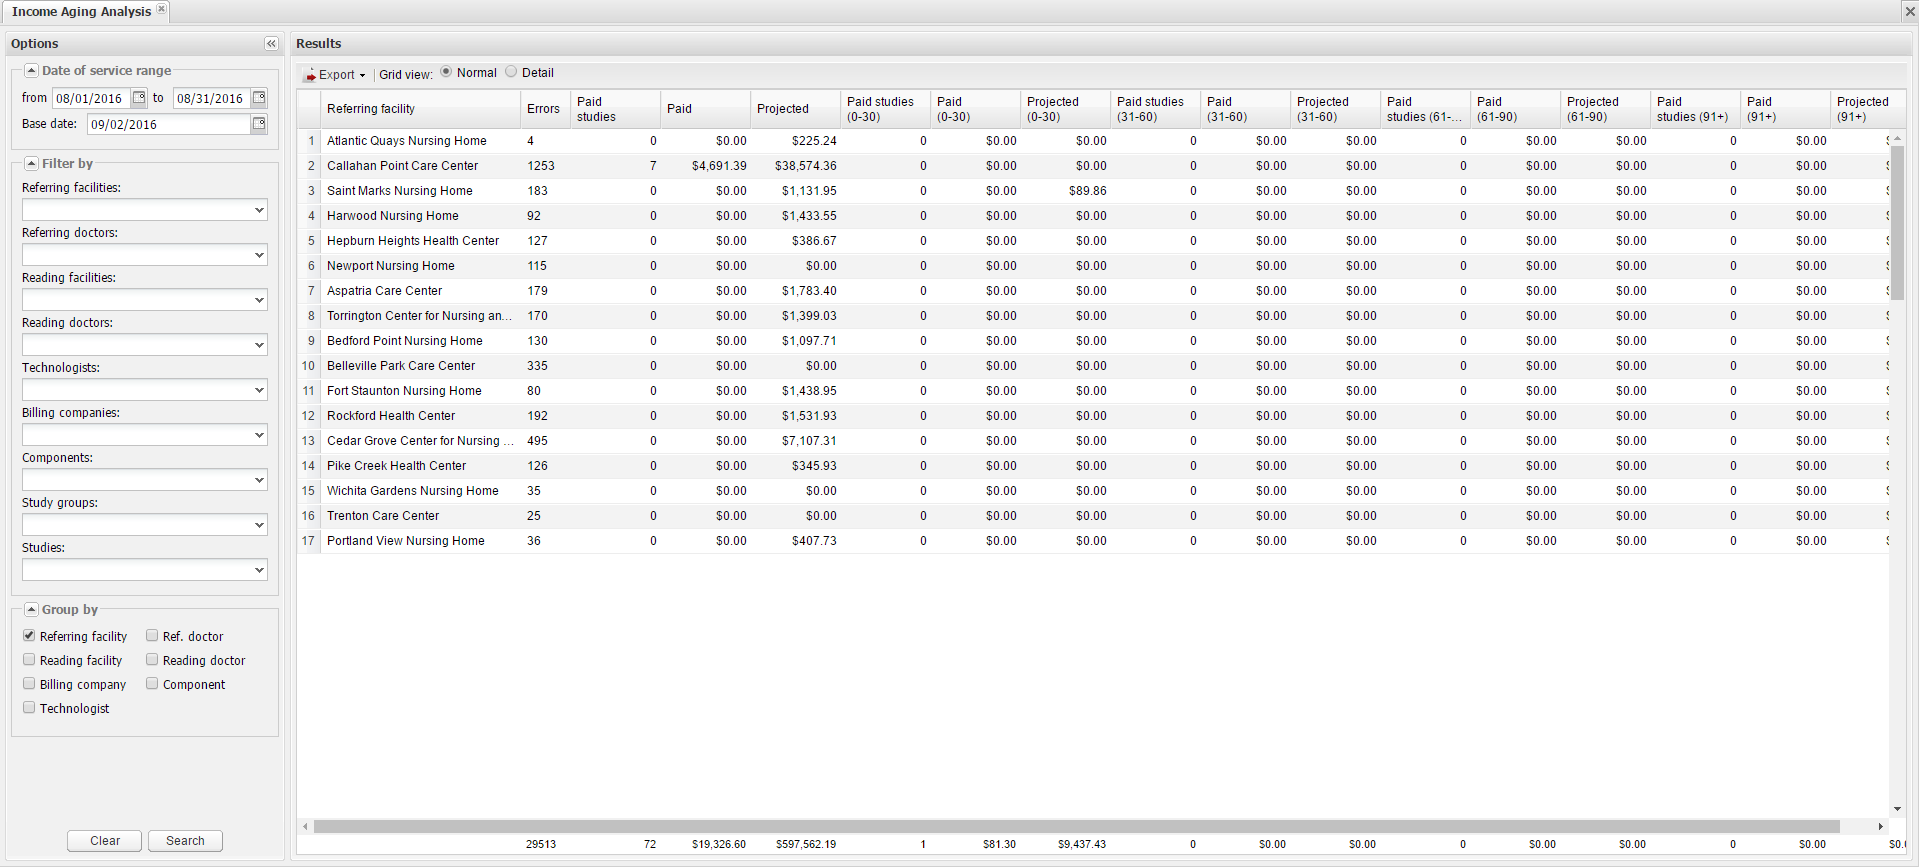
Here you can see the left sidebar and the list of search results (income aging analysis data) on the right.
The left sidebar provides a search filter with numerous search options. It allows you to specify the date of service range (specific date or date range), referring facilities, referring doctors, reading facilities, reading doctors, rendering providers, ordering facilities, technologists, billing companies, components, study groups, studies, and branches. You can also select the way how the search results are grouped: by referring facility, reading facility, rendering provider, billing company, technologist, branch, referring doctor, reading doctor, ordering facility, component, and year/month.
After you specify the necessary fields, click the Search button to display the required finance analysis data. To reset all fields, click the Clear button.
Income aging analysis data is arranged in columns. The first columns represent the selected way of data grouping (Referring facility, Reading facility, and so on). To the right of them, you can see the Errors, Paid studies, Paid, and Projected columns. The last three columns are repeated for several time intervals (0-30 days, 31-60 days, 61-90 days, 91 and over days).
Right above the finance analysis data grid there is the Export button. It allows you to export the finance analysis data to an Excel, Excel 2007, CSV, PDF, or HTML file.
Next to the Export button there is the Grid view control that has two options: Normal (selected by default) and Detail. Click the Detail option to see more columns: Studies, Projected studies, Written off studies, Overdue studies, and Overdue.
To view more detailed information about each group, double-click the required row. The Group details window will appear:
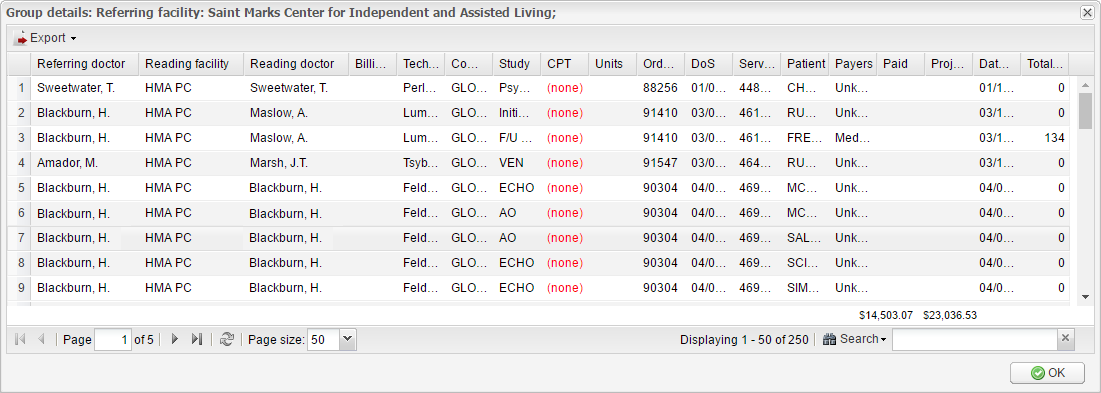
Here you can see the detailed information about each rendered service and study. All data is arranged in the following columns: Referring doctor, Reading facility, Reading doctor, Billing company, Technologist, Component, Study, CPT, Units, Order ID, DoS, Service ID, Patient, Payers, Paid, Projected, Date sent on reading, and Total turnover days.
The Export button in the upper left corner of the window allows you to export the group details to an Excel, Excel 2007, CSV, PDF, or HTML file.
Profit and loss analysis
In this section of the Analysis module, you can view revenues, costs and expenses for a given time range. To open it, click ANALYSIS on the upper navigation bar, then select PROFIT AND LOSS ANALYSIS in the drop-down menu. The Profit and Loss Analysis tab will appear:

Here you can see the left sidebar and the list of search results (profit and loss analysis data) on the right.
The left sidebar provides a search filter with search options. It allows you to specify the date of service range and select the business type, account or facility. You can also select the Debug checkbox to display referring facilities that are not included in any referring account.
After you specify the necessary fields, click the Search button to display the required profit and loss analysis data. The Reload button allows you to reload the search results. It can be useful after you have changed some of the search fields.
Click the Export button to export the profit and loss analysis data to an Excel file.
The profit and loss analysis data is arranged in the following columns: Year, Month, Name, Visits, Tests, Revenue, Collected, Rent, Rent time, Tech Time, Tech Cost, Eqp + Travel, Billing, Reading, Profit, and Margin. At the bottom, you can see the TOTAL row which summarizes the profit and loss analysis data.